
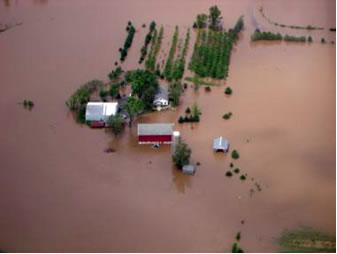
A flooded farm in western Wisconsin, June 2008
Annually, flooding accounts for more damage in Wisconsin than any other naturally-occurring event. Significant flooding over large areas, such as this past June over the southern third of Wisconsin, places huge demands on governments, non-profits and the private sector to respond in a quick and efficient manner.
To quickly understand the magnitude of this year’s flooding, the Department of Military Affairs (DMA), the state agency responsible for coordinating flood response and recovery and home to the Division of Wisconsin Emergency Management (WEM) and the Wisconsin National Guard, turned to several unique mapping sources as tools to improve its coordination and information roles.
A flooding emergency quickly arises
During the weekend of June 7-8, 2008, as heavy rains began to fall across southern Wisconsin, Chris Diller, GIS Coordinator at DMA, was called into the state’s Emergency Operations Center (EOC). Very quickly, Chris realized that he would be called upon to begin collecting data and producing maps showing the extent of flooding that was already becoming quite significant. From experience gained during WEM’s response to floods across much of the same area of the state during August 2007, Chris recalled the usefulness of the broad area coverage of Landsat satellite imagery as an aid in understanding the extent to which areas were affected by floodwaters.
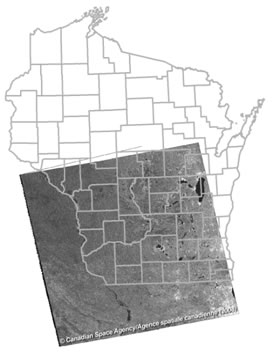
RADARSAT, a program operated by the Canadian
Space Agency, collects medium-resolution radar data
worldwide from several satellites over the same area
every 2-3 days. This image over southern Wisconsin
was collected on June 15th 2008, following a week
of heavy rain across the southern part of the state.
During times of natural or environmental disasters (for example, an oil spill) a consortium of international agencies makes satellite imagery available to organizations in the disaster region. This international consortium works under an agreement called the “International Charter” which was initiated in 1999, and now has member agencies from seven nations including the USA, Canada, France, India, Argentina, China, and Japan. The U.S. Geological Survey (USGS) is an Authorized Data User in times of emergency under the rules of the charter. Authorized users, which are registered with the International Charter, may only request data in response to emergencies that are verified by a project manager working with the International Charter consortium.
Aware of the provisions in the International Charter, Chris contacted Dick Vraga, the USGS Geospatial Liaison for Wisconsin, with a request for satellite imagery over the southern part of the state. In the following week, two very different types of imagery were made available to WEM under provisions of the Charter. The first of these was radar data acquired from two radar satellites operated by the Canadian Space Agency. The Canadian “RadarSat” satellites (RadarSat-1 and RadarSat-2) image the earth by transmitting microwave energy toward the earth’s surface and recording the reflections. Unlike the more common optical satellites which sense reflected sunlight, the RadarSat devices image the earth day or night, in any atmospheric conditions such as clouds rain, dust, or haze. This aspect of radar imaging makes it highly useful during flood events because of continuing cloudy and rainy conditions.
The second type of imagery made available to WEM was satellite images collected by SPOT Image, a long-standing company based in France with receiving stations located around the globe. The SPOT satellite collects the more traditional optical imagery that is useful for land cover mapping under cloud free conditions.
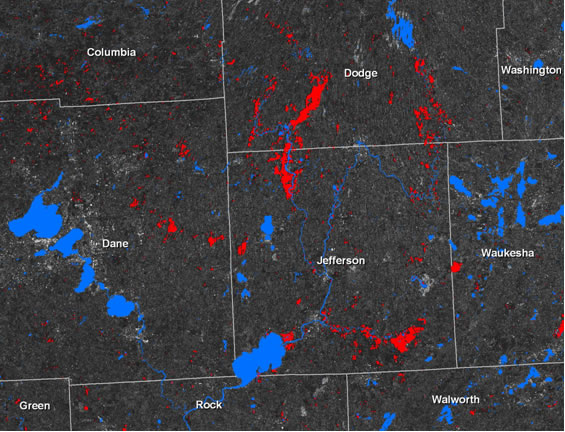
A portion of the June 15, 2008 RadarSat satellite image over southern Wisconsin
showing the extent of normal water in blue, and flood water in red. Digital files
of the flooding are available for public download in the “Flood Data” area.
© Canadian Space Agency/Agene Spatial Canadians (2008)
Flooded areas mapped
With imagery now available, Chris’ next step was to contact WisconsinView Director Dr. Sam Batzli at the UW-Madison Environmental Remote Sensing Center (part of the UW Space Science & Engineering Center). Chris requested help with manipulating and analyzing the RadarSat images to identify flooded areas. Following the request for assistance, Dr. Batzli turned to a former colleague at ERSC, Dr. Jonathan Chipman, an expert on radar imagery who is now a faculty member at Dartmouth College in Hanover, New Hampshire and affiliated with New HampshireView. Radar imagery maps textures, therefore open water appears as a smooth, mostly black tone. Using a series of computer processing steps such as separating dark shadowed areas on slopes from water, and using an existing water dataset to digitally separate “normal” water from “flood” water, Dr. Chipman extracted features from the radar imagery that showed flooded areas in red and the “normal” water areas in blue over a wide area of southern Wisconsin.
As the next step in the mapping process, Chris combined the water data, both normal and flooded, with other map features to produce flood extent maps for nearly 30 counties in southern Wisconsin. The Jefferson County map below is an example. Although general in nature, these maps proved to be extremely useful to WEM, counties, regional planning commissions, politicians and others to comprehend the location and extent of the flooding. Additionally, the State’s Adjutant General, Don Dunbar, used the County Flood Extent maps during helicopter flights to various flooded areas. He commented to Chris “These maps have been invaluable for quickly understanding the location and extent of flooding.”
Overall, the satellite-derived flood maps proved to be a very useful product for a number of state and local organizations. The maps were developed through an unusual combination of data (radar imagery from a Canadian satellite), using a little known agreement to obtain the data (the International Charter), and a research scientist outside the state (Dr. Chipman) to develop a process to extract useful information.
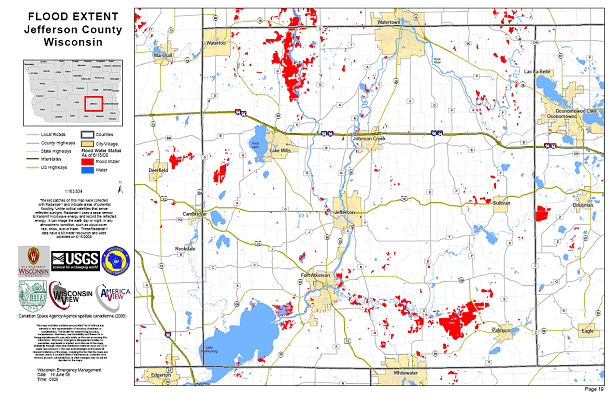
Flooded areas across Jefferson County are shown in red
The satellite images provided a timely perspective of the extent of the emergency that was not readily available through any other means. This combination of organizations and individuals working efficiently together is an example of excellent coordination between different entities brought together quickly to address a very serious problem affecting thousands of people and their homes and businesses.
The type of imagery analysis done by Drs. Batzli and Chipman using radar images has never been done in Wisconsin before over such a large area. The results of this work are still being analyzed as there is some belief that the areas shown as flooded on the maps may be 10-20% less than what actually occurred. WEM staff and others will continue an effort to compare the size and extent of flooded area measurements made on the ground against the derived image data to assess the accuracy of the mapped information.
The coordination and work on this response effort by DMA, WisconsinView, and ERSC presents a fine example of both highly technical and complex coordination work. For many years earth remote sensing in the United States relied on the Landsat satellites. With the decline of Landsat and the significant reduction and realignment of ERSC, creative coordination of expertise and resources has become paramount. Dr. Batzli hopes that coordination of expertise through the WisconsinView and AmericaView networks along with coordination of data access through USGS and WEM will facilitate similar disaster responses in the future.