Are you interested in exploring the projected climate and potential climate impacts for your community? Are you involved in planning efforts or adaptation strategies where a detailed assessment of future conditions would help decision-making? GIS-compatible climate modeling data is now available to conduct these types of analysis for specific communities and regions in Wisconsin.
In their 2021 Assessment Report and on their website, the Wisconsin Initiative on Climate Change Impacts (WICCI) provided several small-scale images of future conditions in Wisconsin for one future climate scenario (RCP 4.5), but the data for these maps and other climate scenarios, e.g. RCP 8.5, wasn’t easily available. The Geospatial Working Group of WICCI, in cooperation with the Climate Working Group, has created a set of GIS-compatible datasets to replicate these maps, explore other climate scenarios, and conduct more site-specific analysis.
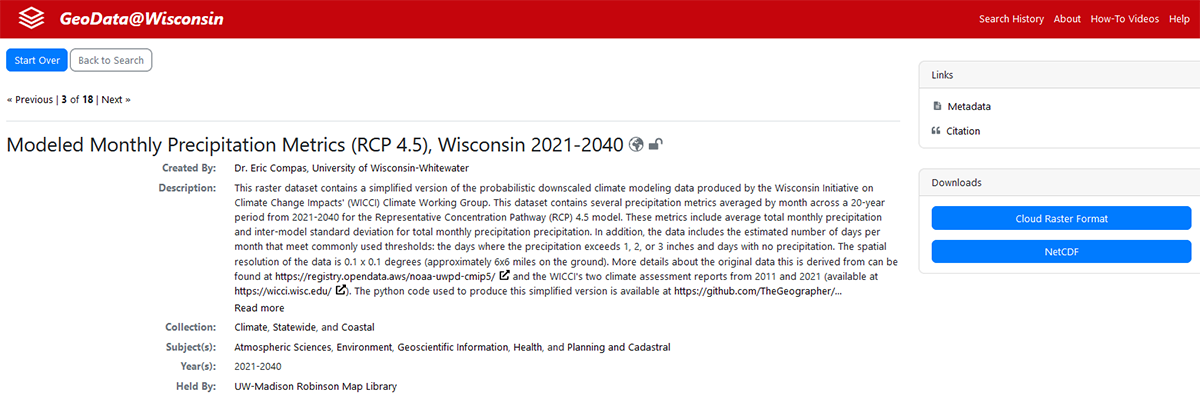
Access to the data can be found at GeoData@Wisconsin and the user guide is available in print and video. Data is available both in an ESRI cloud raster format and an open NetCDF format and can be viewed and analyzed in tools such as ArcMap, ArcGIS Pro, and QGIS. Variables include average high and low temperatures, total precipitation, and several threshold metrics such as days above 100° F.
Example Analyses
Here are several examples of the type of analysis possible using this data (using ArcGIS Pro).
Question: How many days on average will high temperatures in July be above 90° F in 2041-2060 (using the RCP8.5 scenario)?
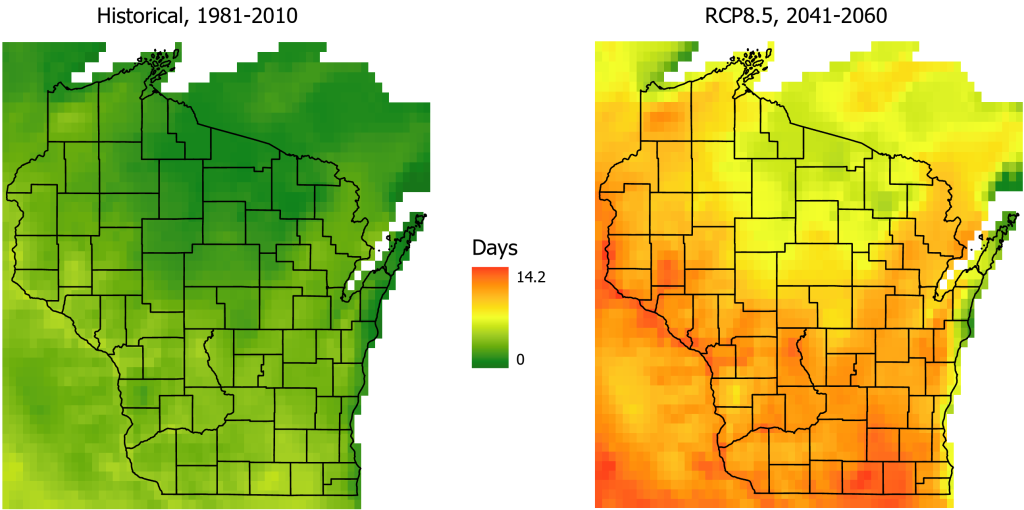
From these maps, it’s apparent that the number of warm summer days will increase substantially across the state, but mostly in the south and southwest. That could mean an increasing reliance on air conditioning for sensitive community members or negative impacts on cold-water fisheries.
Question: How many days will be above 90° F in La Crosse, Wisconsin, in 2041-2060 (RCP8.5 scenario) compared to historical conditions?
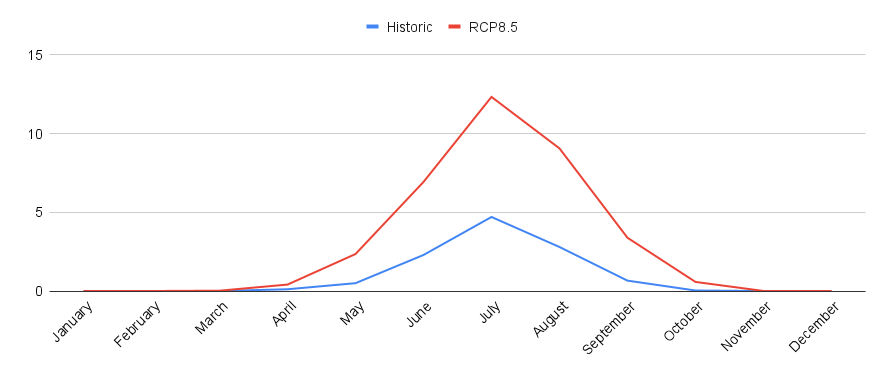
Here, we can see a specific increase from 5 days per month in July on average to over 12 days per month by 2041-2060, representing a 240% increase in the number of warm days for La Crosse.
Looking at extreme precipitation events, we might ask:
Question: What’s the increased likelihood of a 3” rainfall in Douglas County in 2081-2100 (RCP8.5 scenario) as compared to historical conditions?
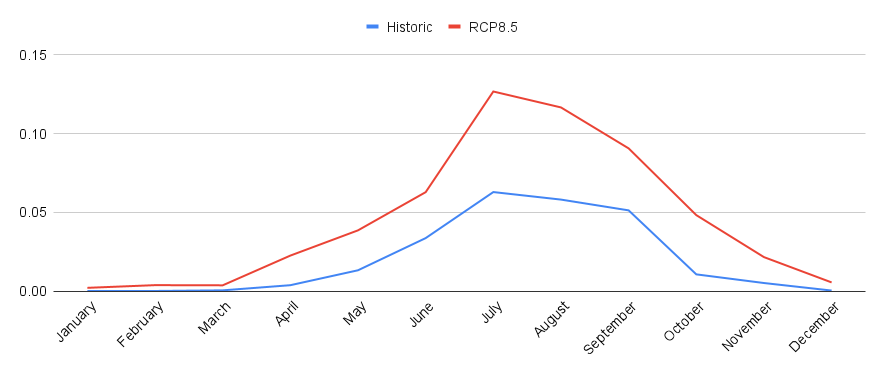
In historical conditions, there are 0.06 days per month in July on average with a 3” or greater rainfall event in the county, but this is projected to increase to 0.13 days per month in 2081-2100. That represents a 217% increase in the chance of a significant summer rainfall event.
The user guide explains how to conduct these example analyses and more.
Details
More information about the raw modeled climate data is available here. Access to the original data and a review of the final product was provided by the WICCI Climate Working Group.
In brief, this data is an aggregation of 22-24 global climate models (GCMs) that were statistically downscaled to a 0.1 x 0.1 degree (approximately 6 x 6 miles in Wisconsin) for two climate scenarios, RCP 4.5 and RCP 8.5 (more details here). In addition, there is historic climate data covering 1981-2010 for comparison. The aggregation was conducted monthly across 20-year time spans: 2021-2040, 2041-2060, 2061-2080, and 2081-2100. For each there are several temperature and precipitation metrics as detailed in the user guide. The Python code used to generate these files is available in a GitHub repository if you’d like to review or modify the code.
These temperature and precipitation metrics allow for comparison between models, comparisons of future conditions to historic ones, and trend analysis through time.
Accessing the data in GeoData@Wisconsin
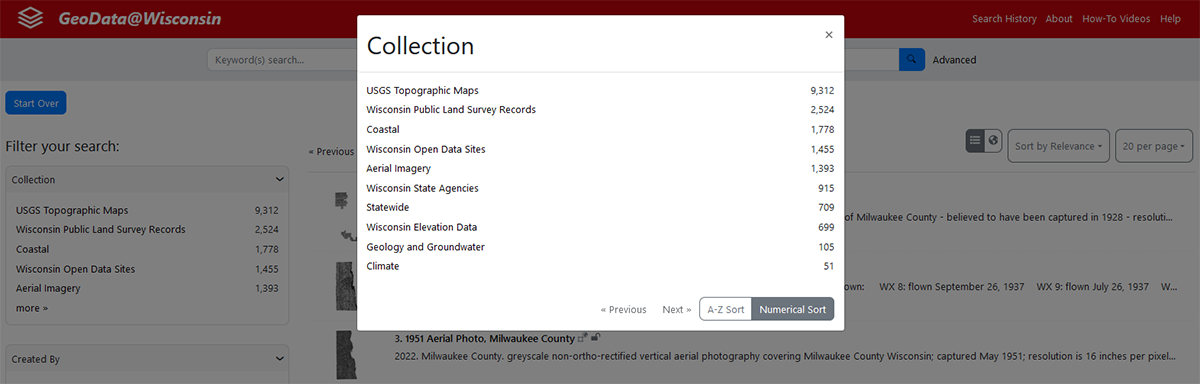
The easiest way to quickly get to the downscaled climate data in GeoData@Wisconsin is to utilize the ‘Climate’ collection. From the main GeoData@WI landing page, click ‘Browse All’. Next, expand the ‘Collection’ filter and choose ‘Climate’.
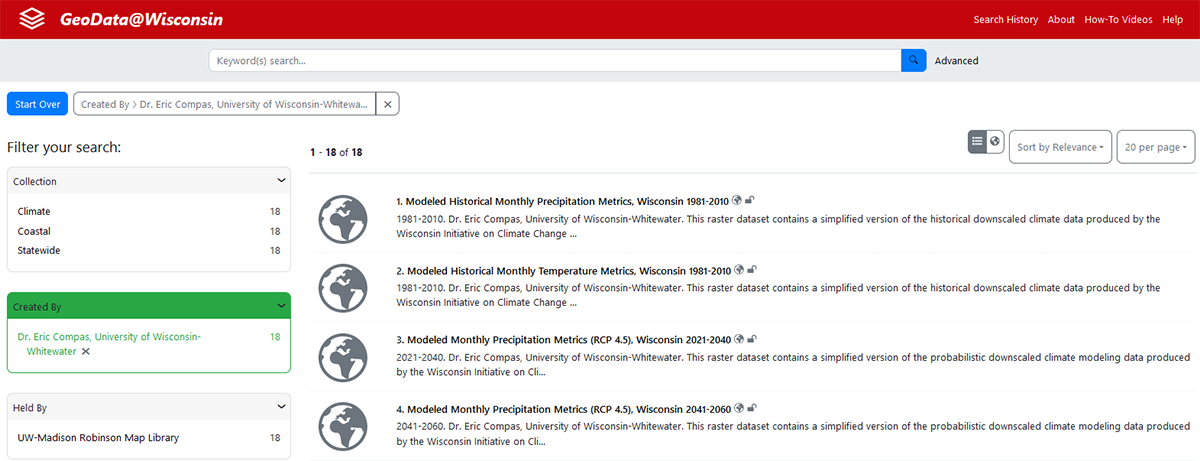
From there, use the ‘Created By’ filter, and click on ‘Dr. Eric Compas, University of Wisconsin-Whitewater’:
Each dataset item page includes metadata that describes the resource. The downscaled climate data can be downloaded in Cloud Raster Format, or NetCDF: