
 The SCO’s latest online app is the Bordner Survey Viewer, which replaces the old Coastal Bordner Survey Explorer.
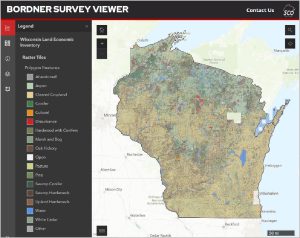
As discussed in a previous blog post, The Bordner Survey was a massive 1930s-era effort to map land use across the state. The genesis of the project was an attempt to understand the impacts of land use decisions made decades earlier. In northern Wisconsin, most forested land had been cut, and attempts to farm this land often met with failure. In 1927, the Wisconsin state government and the University of Wisconsin agreed to collaborate on a detailed land inventory of northern Wisconsin, to provide accurate information about land use and land suitability for agriculture and forestry. The effort was led by John Bordner, a Wisconsin farmer who earned a PhD in plant physiology in 1908. Bayfield was the first county completed by the Bordner Survey (technically the Wisconsin Land Economic Inventory). The project expanded to cover the entire state with the exception of Milwaukee and Menominee Counties.
Digitizing the Bordner maps began at UW-Madison’s Forest Ecosystem and Landscape Ecology Lab in the Department of Forest and Wildlife Ecology, under the direction of (now Emeritus) Professor David Mladenoff. Mladenoff’s students started a major effort in the early 2000s, after Mladenoff and several of his students completed a number of townships some years earlier. This blog post gives more details on this effort, including sources of funding used.
Over the last ten years, the remaining undigitized Bordner maps were finished by UW-Madison and UW-Platteville staff and students. Several hundred staff and students were involved in the effort. In 2024-25, with the help of funding from the Wisconsin Department of Natural Resources, a statewide version of the dataset was created by the State Cartographer’s Office by merging all of the previously digitized pieces. The final step in the process was to create the new online map viewer. The new viewer includes all polygons from the paper maps. Lines and points have not yet been completed.
The new app was built primarily by Joseph Kowalczyk, an SCO student intern in the summer of 2025 and a graduate student in GIS at UW-Madison. SCO staffers Mike Hasinoff and Hayden Elza also contributed, as did Matt Noone at the Capital Area Regional Planning Commission.
The statewide Bordner dataset is also available for download on Geodata@Wisconsin. The user guide document can be found here. The user guide includes field descriptions for the attributes for each polygon, and describes how the land cover categories were created for the final map display in the new app.
I hope you’ll take a few minutes to explore this rich and unique historic geospatial dataset.