
Authors
Ann Buschhaus and Howard Veregin
Summary
This article gives a summary of a project recently completed in the State Cartographer’s Office (SCO) related to flood risk assessment in northern Ashland County, Wisconsin. The project was funded by the Wisconsin Coastal Management Program and the National Oceanic and Atmospheric Administration. Ann Buschhaus was the GIS Researcher who carried out the project, while Howard Veregin served as Principal Investigator.
Project Goals
The main goal of the project was to develop a detailed building inventory for northern Ashland county, combining building footprints, parcel data, critical infrastructure points and local tax assessment records into a single geospatial layer. Detailed building data can help make assessments of flood risk more accurate, by allowing for site-specific estimates of flood damage and loss. It is widely known that GIS data is useful during and after flood events, but it also has a role before disasters occur, such as at the planning stage when communities are developing hazard mitigation plans.
Work in other states has shown how building inventories can be used to assess flood vulnerability and estimate flood damage and loss under various precipitation scenarios. Detailed building inventories can be used in models such as Hazus in place of more generalized regional averages, offering the possibility of better estimates of flood risk and damage.
The Ashland County project sought, not just to create a detailed building layer, but to put the tools and methods we developed in the hands of planners and managers, so that better decisions could be made about flood vulnerability. This was to be achieved through a detailed workflow description and a transferable cost model (to allow the cost of dataset creation to be estimated in other coastal areas). Several outreach events were also held to present results to stakeholders.
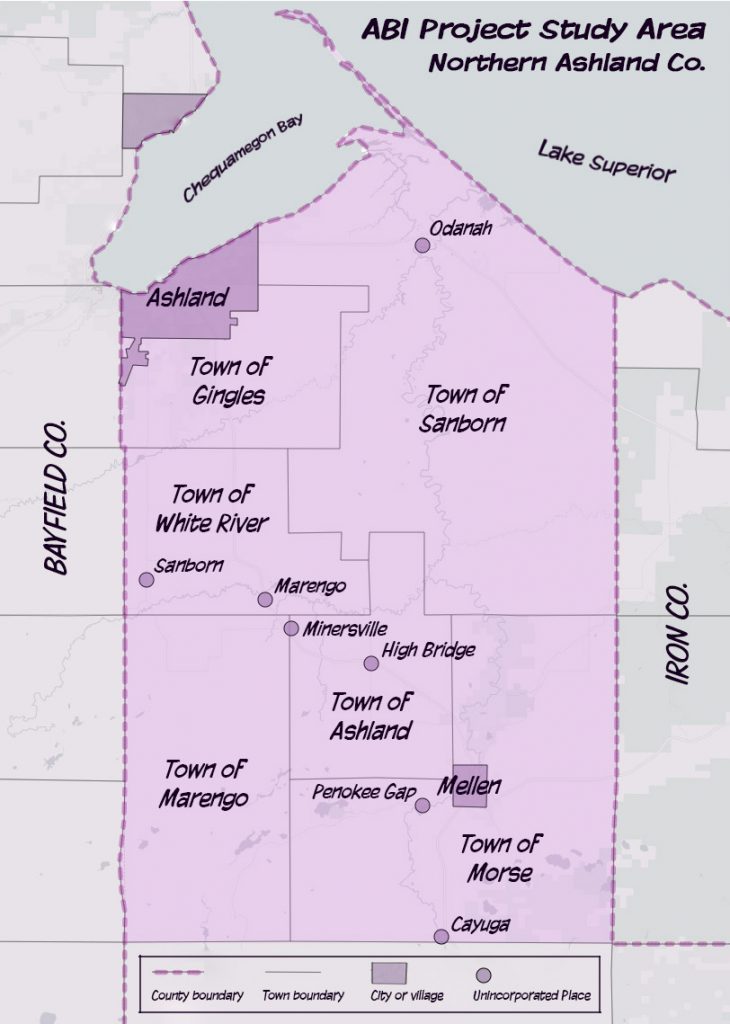
The project focused on northern Ashland county, an area that has experienced several devastating floods in recent years with significant impacts on infrastructure. As noted in the 2018 Ashland County Hazard Plan, “there is a very high probability of damage and losses due to flooding” in this area with potential vulnerabilities that include residential structures, businesses and “flooded public facilities and schools, many of which are the community’s shelters needed when individual housing is uninhabitable.”
At the proposal stage we identified the biggest challenge of the project to be related to data sources. Four sources would be required: 1) accurate building footprints; 2) valuation data for improvements recorded at the tax parcel level; 3) detailed local tax assessment data for the structures on each parcel; and 4) information on tax-exempt structures for which no assessment data exists.
Challenges
As the project progressed, data indeed stood out as a significant challenge, although in ways we did not always anticipate. Some of the more significant issues we discovered are described below.
Building Footprints
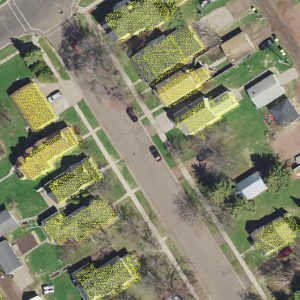
Our original intent was to extract building footprints from newly acquired LiDAR data (ca. 2019 acquisition). We had found that building footprint data layers – for many counties derived from air photos – tend to contain errors, including parallax distortion, conjoining of separate buildings into a single polygon, and missing attribute data. Our objective was to use LiDAR-derived footprints in place of such existing footprints.
Unfortunately, the release of LiDAR data in our study area was significantly delayed and the LiDAR data that was available at the start of the study was out-of-date. As an alternative, therefore, we used an existing building footprint dataset. Like most counties in Wisconsin, Ashland County has a building footprint layer available for free download from Geodata@Wisconsin (link), collected as part of the annual statewide parcel project call for data. We explored this data layer and concluded that the work associated with cleaning it to remove errors induced by parallax and blobs (mostly buildings that overlapped neighboring parcels and had to be clipped, or blobs that had to be subdivided) could be included in the ‘manual’ work associated with completing the intersection of buildings and parcels.
Once the newer LiDAR data became available, we conducted a demonstration study of 2,100 buildings using off-the-shelf tools for building extraction from the classified point cloud. The extraction process and associated cleanup to ensure smooth and orthogonal building footprints was found to be a labor-intensive process, consuming 10 hours per 1,000 buildings on average. At the end of the process, further cleanup and attribute creation was still needed. For example, the classified point cloud misclassifies a lot of points, and garages are frequently missed. Straightness/orthogonality constraints must be applied to get good-looking footprints, but the process is slow and very manual. Finally, attributes are lacking except for basic information such as footprint square footage.
Parcels
Parcel attributes for each building footprint were extracted from the V7 Statewide Parcel Dataset. This was achieved through a spatial join of the polygons from the two layers (footprints and parcels). Parcels allow us to assign a tax ID from each parcel to the buildings on that parcel, to join to assessment data.
Integrating parcels into building footprints is a time-consuming step due to ambiguity in relationships between parcels and buildings. Issues encountered during the process included: many one-building to multiple-parcel scenarios; misalignment of building and parcel boundaries (sometimes producing narrow slivers); and single building polygons that are actually multiple buildings (“blobs”), including buildings on different parcels sharing a wall and building polygons where buildings that are actually separate are joined together.
Multiple buildings on one parcel is another common scenario but not necessarily indicative of an error; for example, many residential parcels have a house as well as a detached garage or a shed. In this case, all parcel attributes were transferred to each building. In the opposite scenario, when one building stretches across multiple parcels, the correct parcel attributes must be attached to the building based on attributes. For example, only one of the parcels may have a non-zero value for assessed value of improvements. Thus, the attributes for that parcel would be attached to the building.
Assessment Data
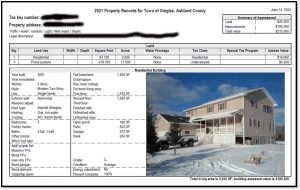
Assessment data proved to be the biggest challenge associated with the project. The primary attributes of importance for flood risk assessment to be collected from assessment data include: square footage of the main building and any outbuildings; property/occupancy type; and the features of the foundation including the presence of a basement and/or the height of the building above ground. While we anticipated some complexity would be found with assessment data, we assumed (based on an earlier pilot study) that these problems would be technical in nature (data formats, for example) but instead the issues were cost, redistribution restrictions, and the difficulty of obtaining data in a usable digital format. In the short space available here, the following summary of the issues is presented:
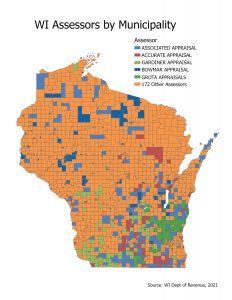
- In Wisconsin, tax assessment is conducted locally. Within any county, the cities, villages and towns are free to contract with whichever tax assessor they choose, and there is no statewide or countywide aggregation of tax assessment records and no centralized data storehouse. In our study area, we have several different assessment companies: Associated Appraisal Consultants (City of Ashland, Town of Gingles), Bowmar Appraisal (City of Mellon), and others for the remaining municipalities. Each assessor is responsible for discharging the municipality’s duty to maintain electronic assessment records. The municipality is the official steward of the data. They delegate that responsibility to their assessor. When there is a public data request, it is the municipality that receives the request (e.g., city clerk). They hand the request off to the assessor, who have the data on their computers.
- In the first scenario, the assessor hands over a batch of PDFs for the properties of interest, often a single PDF with many property records. PDF format satisfies the electronic records requirement. There is a cost for these PDFs, perhaps $30/hour or whatever the assessor thinks is reasonable for their time. There are no restrictions on redistributing the PDFs or any data that can be extracted from them. The difficulty lies in extracting data in a digital format that is usable in GIS. While this may sound simple, it is not necessarily so.
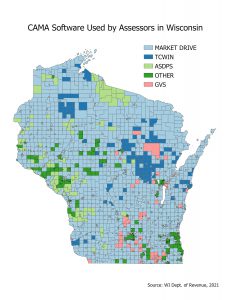
- There is another caveat and that is that the first scenario is based on the assumption that the assessor is using Market Drive CAMA (Computer Assisted Mass Appraisal) software. Market Drive is used by about 80% of municipalities in Wisconsin. All of the assessors in our study area except the one serving the Town of Sanborn use Market Drive. If the assessor is not using Market Drive the situation is different, and needed information may or may not be readily available via PDF.
- A second scenario occurs when the requester wants usable digital data, not PDFs. This is a fundamentally different request; it is no longer a request for public data, but a request for a product. Assuming the municipality is using Market Drive, the assessor would need to send their data to Market Drive to process. The assessor is under no obligation to do so. Market Drive, meanwhile will charge the requester for the data, somewhere between 10 and 50 cents per record. The format is digital but it will be XML, which needs to be translated into a format that is more usable. The data also comes with redistribution restrictions. It is a one-time snapshot, not a subscription, that is being purchased. The requester must buy an entire municipality, or be prepared to pay a higher cost for a custom geography. Finally, Market Drive could decline the request to provide the data.
- For a small project like this one, these roadblocks required more resources than could be brought to bear. Other researchers looking to perform a similar function will need to either accept data distribution restrictions and budget for XML data acquisition costs, or be prepared to fund the development of a PDF data extraction tool if PDFs are to be used.
Tax-Exempt Data
Obtaining data on tax-exempt properties and critical infrastructure was also a difficult task, although this was anticipated going into the project. The problem is a lack of publicly-available, accurate, complete data on such properties. There is a very little data with any building-specific information that is publicly usable, which points even further to the importance of assessment data if it could be obtained. In our case we used three free, public sources: Open Street Map; the IRS Tax Exempt Organizations List, which we geocoded (unless a PO Box); and the National Structures Dataset.
We pulled what we could from these sources to get structure information at a deeper level than what the parcel dataset would tell us (e.g., commercial, industrial, etc.). We were able to get some information on structure type (e.g., gas station, car wash) in a few cases.
Lessons Learned
The main lesson from our study is one that has implications for others attempting to collect and use assessment data. Given the current landscape in the state of Wisconsin it is virtually impossible for a groups with limited budgets to collect assessment data in an easily used digital format free from distribution restrictions. People intending to use such data need to budget for it, whether to acquire data directly or to develop tools to extract it from PDFs.
Assessment data is useful for more than flood risk assessment. At the start of the project we performed outreach to stakeholders to identify possible uses for assessment data, which included: zoning and permitting enforcement; tax equity and fairness; socio-economic analysis and economic development; social services; damage estimates from disasters; disaster planning and mitigation; environmental justice and social vulnerability; emergency response; and insurance.
A second lesson is the cost of LiDAR data extraction of building footprints. Initially thought to be our source for these footprints, the cost of extracting and cleaning the data made this a less attractive alternative than using improved building footprints provided by the county. Since our goal was to focus on things that are usable by small local governments, cost and ease of creation is definitely an issue.
A final lesson is continued lack of high-quality, current, complete data on public buildings including tax exempt structures. Where such datasets do exist they are either proprietary (and thus expensive) or not public. What is lacking is a publicly accessible version of such data that includes information on building occupancy type and other characteristics. This information would be useful not just for flooding studies but more broadly. Effort should be made to consolidate existing sources of data and maintain this. What state agency might be responsible, or how it might be funded, is an open question, but there is no denying the utility of such data for a variety of purposes.
More Information
More information on this study can be found on the slides and commentary from our final workshop, available on the SCO website.

The workflow and cost model graphic is also available on the SCO website.
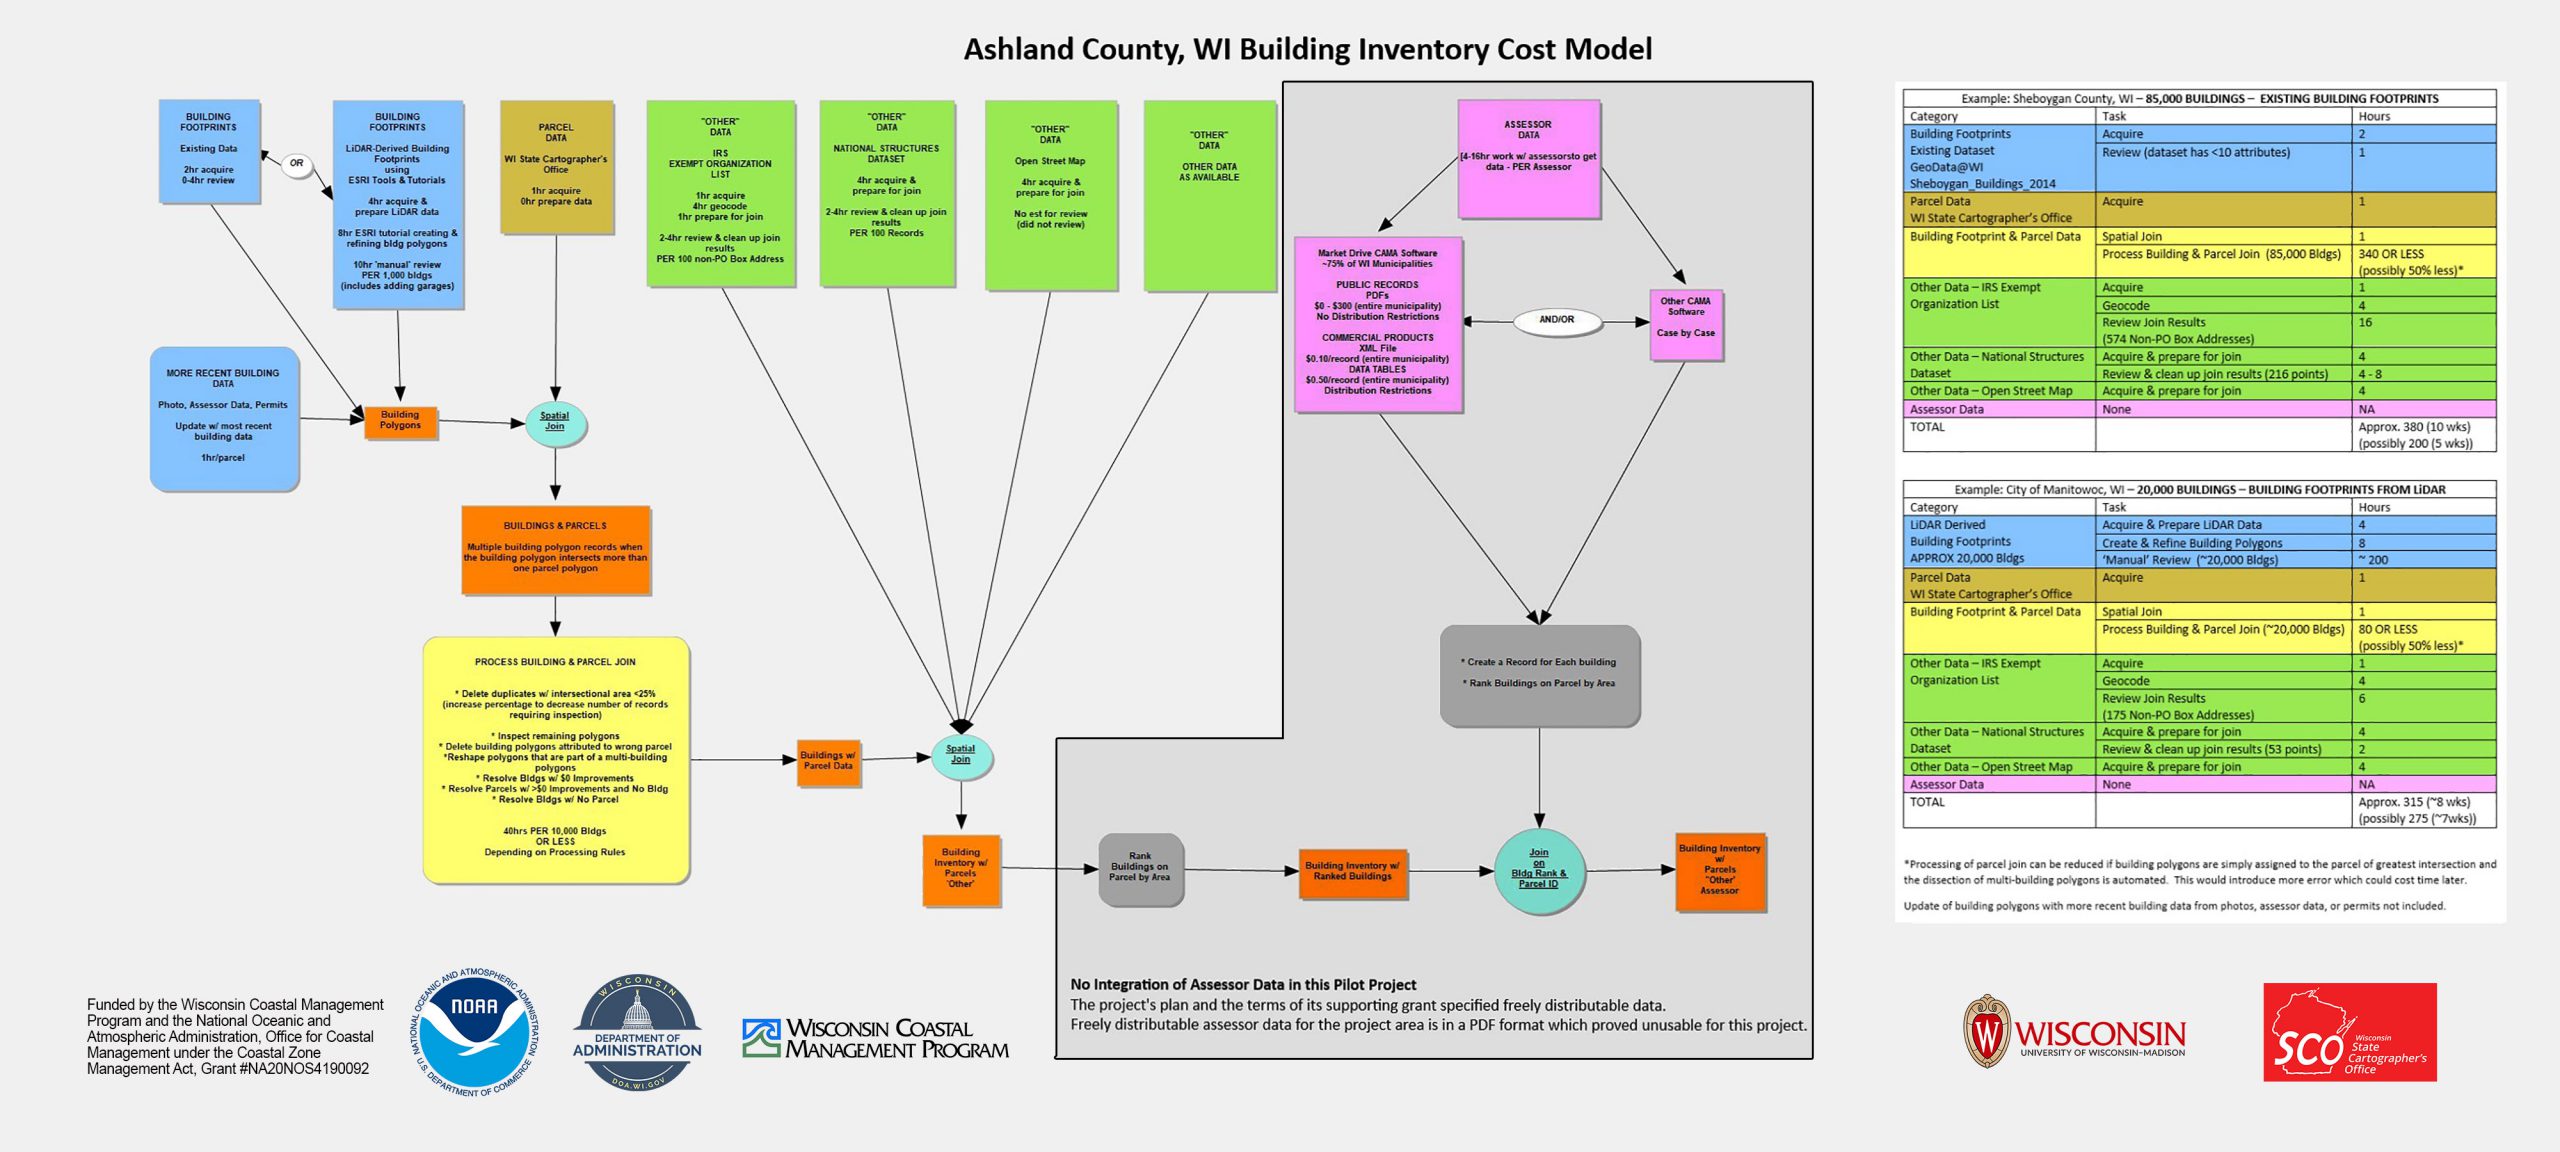
Our final GIS layer, while not as comprehensive as we had planned, is available on the Geodata@Wisconsin geoportal. The layer has a footprint for all known buildings in the study area, along with attributes derived from the join to the parcel database and the sources of other data. Building counts are shown in the table below.
| Municipality | Residential | Non-Residential | Total |
| City of Ashland | 5,368 | 1,287 | 6,655 |
| City of Mellen | 530 | 132 | 662 |
| Town of Ashland | 693 | 191 | 884 |
| Town of Gingles | 646 | 143 | 789 |
| Town of Marengo | 467 | 83 | 550 |
| Town of Morse | 745 | 195 | 940 |
| Town of Sanborn | 273 | 648 | 921 |
| Town of White River | 706 | 261 | 967 |
| Total | 9,428 | 2,940 | 12,368 |
Acknowledgement

This project was funded by the Wisconsin Coastal Management Program
and the National Oceanic and Atmospheric Administration,
Office for Coastal Management under the Coastal Zone Management Act,
Grant #NA20NOS4190092.