
Google’s My Map tool is an easy way (maybe THE easiest way) to make a simple web map. This tool allows you to load multiple layers of map data (point, line or area), change colors and symbols, and import photographs. You can share the resulting map with anyone using a web link, and you can even designate specific people as editors using the Drive Sharing option, making collaboration possible. If you want to add your map to an existing website you can embed it using an HTML iframe tag. My Maps are also mobile-ready, which means they function correctly on your smart phone, not just on your computer.
in Kewaunee County
It takes only minutes to make a My Map and no specialized software is needed. It’s a great way to make a quick web map for a project you’re working on or construct a simple prototype of a more complex web app you’re hoping to build.
In this post I’m going to illustrate how simple My Maps is by creating a map of unincorporated communities in Kewaunee county. Unincorporated communities are typically small population clusters in rural areas. Because they lack legal status – unlike incorporated cities and villages – unincorporated communities aren’t mapped very consistently. They show up on some maps and not others. Only a small fraction are tracked by the Census Bureau. Nevertheless, unincorporated communities are important because they are real places where people live and work. They are also important for locating historic information, even something as basic as a birth or death record.
It’s important to continue documenting the locations of unincorporated communities because they are disappearing as the state’s rural population continues to decline. The State Cartographer’s Office (SCO) has been working on an unincorporated community mapping project for a number of years. Here’s a short video introduction to the project if you are interested.
I chose Kewaunee County for this My Maps example because, like other counties in the northeast part of the state, it has a high density of unincorporated places. As we will see, these communities were created mainly by European immigrants who arrived in Kewaunee County in the second half of the 19th century.
Data
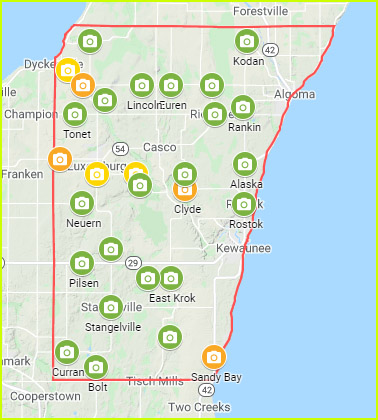
The Kewaunee County My Map contains two layers. The first is a point layer of unincorporated community locations and the second is an outline of the county.
The point layer will be imported into My Maps from a standard Microsoft Excel file, which I created (Fig. 1). You can also use another format, like comma-separated value or CSV, if you do not use Excel. And of course, since My Maps is a Google product, a Google Sheets spreadsheet can also be used.
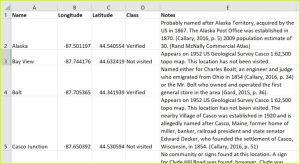
You can choose to include whatever fields you want. The fields I chose for my Excel file include the name of the community, the latitude and longitude, the class (whether it has been verified on the ground or not) and notes on the origin of the place name and the population. For place names I relied on Edward Callary’s “Place Names of Wisconsin” and Robert Gard’s “The Romance of Wisconsin Place Names.” Population estimates are from Rand McNally’s 2009 “Commerical Atlas and Marketing Guide.”
Where do the latitude and longitude values come from? If you watched the video, you will know that we use a smartphone to capture geotagged photographs of unincorporated community signs. The photograph gives us the community name and the geotag gives us the location (latitude and longitude). In case you didn’t know, smartphones automatically geotag photographs using the GPS chip inside the phone. The location is written to a header in the JPG image.
If you do not have latitude-longitude values, that’s okay because My Maps also allows addresses and place names to be used for locations.
The second layer for the map, the outline of Kewaunee County, is a one-polygon extract from a GIS shapefile, saved in KML format, which My Maps recognizes. If you don’t have access to GIS software, you can skip adding a layer like this.
The Map
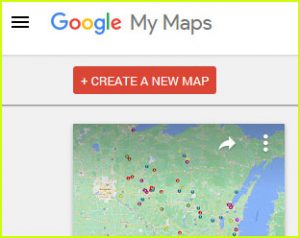
To start mapping, sign into My Maps in your browser and click on Create a New Map (Fig. 2).
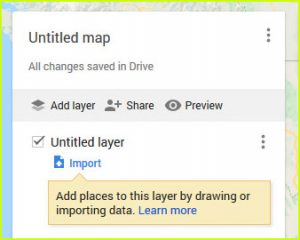
Next, select Import to import your two layers, one at a time (Fig. 3).
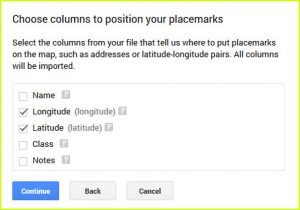
My Maps will now ask you for information about the location field(s) in your data. My Excel file has latitude and longitude values (Fig. 4).
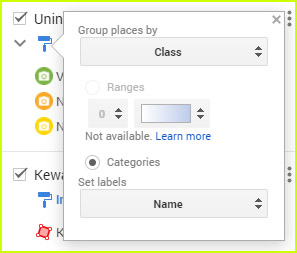
To style the layers, click on the paint roller icon underneath the layer name (Fig. 5). For my point layer, I symbolized the features using the “Class” field and chose the “Name” field for labels.
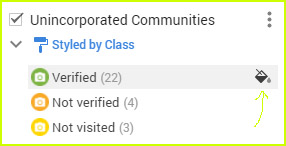
You can click on the little paint bucket symbol beside each of the classes of features to choose an icon and color (Fig. 6).
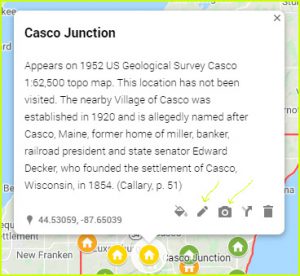
When you click on a map symbol, a popup window appears. To configure this window, click on one of your symbols (it doesn’t matter which one) and select the edit pencil (Fig. 7). This way you can turn data fields on and off for display. By selecting the camera icon you can add photographs. I used this feature to add photographs of the unincorporated community sign for each location, as well as other photos associated with the community such as cemeteries, churches and other buildings.
You can add photos from your device, from Google Drive, from a personal website or a data sharing site, or even by entering a web link (URL).
That’s about it for creating the map. You can spend some time tweaking it by changing the basemap, adding a title and description, and so on. I will not go into detail because the options are limited and it’s fairly easy to figure out on your own.
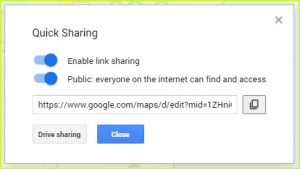
The last step is to preview the map and then, if you like it, share it. You can configure the sharing options to suit your needs. Use the Drive Sharing option to allow other designees to be a map editor, to allow for collaboration (Fig. 8).
The Unincorporated Communities
The finished unincorporated community map of Kewaunee County is here.
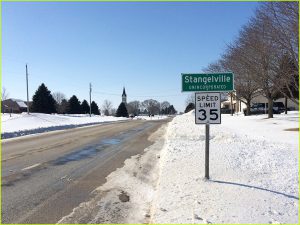
I hope you will take a few minutes to look at it, read the descriptions of some of the communities, and look at the photos. What’s striking about the communities in this area is the prevalence of Czech and Belgian names, like Stangelville (Fig. 9), due to the national origins of 19th century European immigrants.
You may also observe that many communities are named after people, whether whole families or prominent businessmen or politicans. Equally common are place names that mirror cities and regions in Europe that were home to the people who moved here. This is no doubt a common pattern over the rest of the state too.
County Roads AB and J.
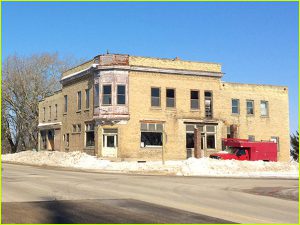
Many of these communities started out providing services to the local area, such as mills and stores (Fig. 10). Just as important were the post offices established in the late 1800s at many locations. These obviously served an important function in the days before automobile traffic; they began to be decommissioned in the decade after 1900. The US Postal Service has information on some, but not all, of these early post offices.
in Stangelville
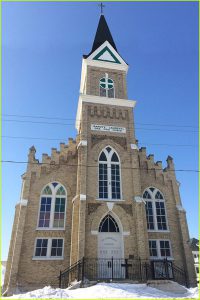
Kewaunee County shows the familiar pattern of ascendancy and decline in rural areas, with all but a few communities losing most of their inhabitants and their commercial functions to larger centers nearby. Meanwhile the imposing churches and lonely cemeteries, along with a scattering of other buildings, stand in ironic contrast, symbolizing the conviction of earlier residents that their communities would endure and survive (Fig. 11).
There are dozens of additional churches, cemeteries, schools, banks, corner stores, gas stations, factories, elevators, mills, abandoned airstrips and collapsing farm buildings in Kewaunee County – not to mention the rest of Wisconsin – that have not been systematically documented. Many will soon be gone for good.
Cartography for Everyone!
You don’t have to be interested in unincorporated communities and the decline of rural America to use My Maps. You can use this tool for whatever point, line or area features you want. The simplicity of My Maps means that anyone can make a web map, even if you don’t have coding skills or know that much about GIS. Hopefully this will contribute to the goal of making cartography more approachable, which will in turn translate into even wider utilization of maps and geospatial data to improve analysis and decision-making.